OProtInDepth
A proteomics analysis platform for clinical research teams working with Olink NPX data.
Problem
Olink's NPX output is a specialised format, and the teams working with it typically stitch together R scripts, Excel workbooks, and ad-hoc plotting to run an analysis end to end. The workflow is slow, hard to reproduce, and discourages iteration on analysis choices that should be cheap to revisit.
Approach
A Next.js frontend handles upload, cohort/covariate configuration, and result review. A FastAPI service runs the analysis pipeline across thirteen modules: NPX parsing and QC, differential abundance via Welch's t-test with Benjamini-Hochberg FDR correction, ElasticNet logistic regression with nested cross-validation, sparse co-expression networks via Graphical Lasso and Louvain community detection, and pathway enrichment against Enrichr (GO + KEGG), STRING PPI, and Reactome. Supabase stores runs, artifacts, and per-user access; Plotly powers the interactive figures so a reviewer can drill into a volcano or enrichment plot without leaving the report view. Methods text is auto-generated with citations for inclusion in manuscripts.
Stack
Synopsis
The scope covers the complete proteomics analysis loop for Olink NPX data — ingest and QC through differential abundance, pathway enrichment, co-expression networks, classification, and auto-generated methods text. The purpose is to give bench scientists without dedicated bioinformatics support a no-code path from raw NPX file to publication-ready figures, while preserving the statistical rigour a reviewer will scrutinise.
Outcome
Feature-complete: 13 analysis modules and 116 passing tests.
Gallery
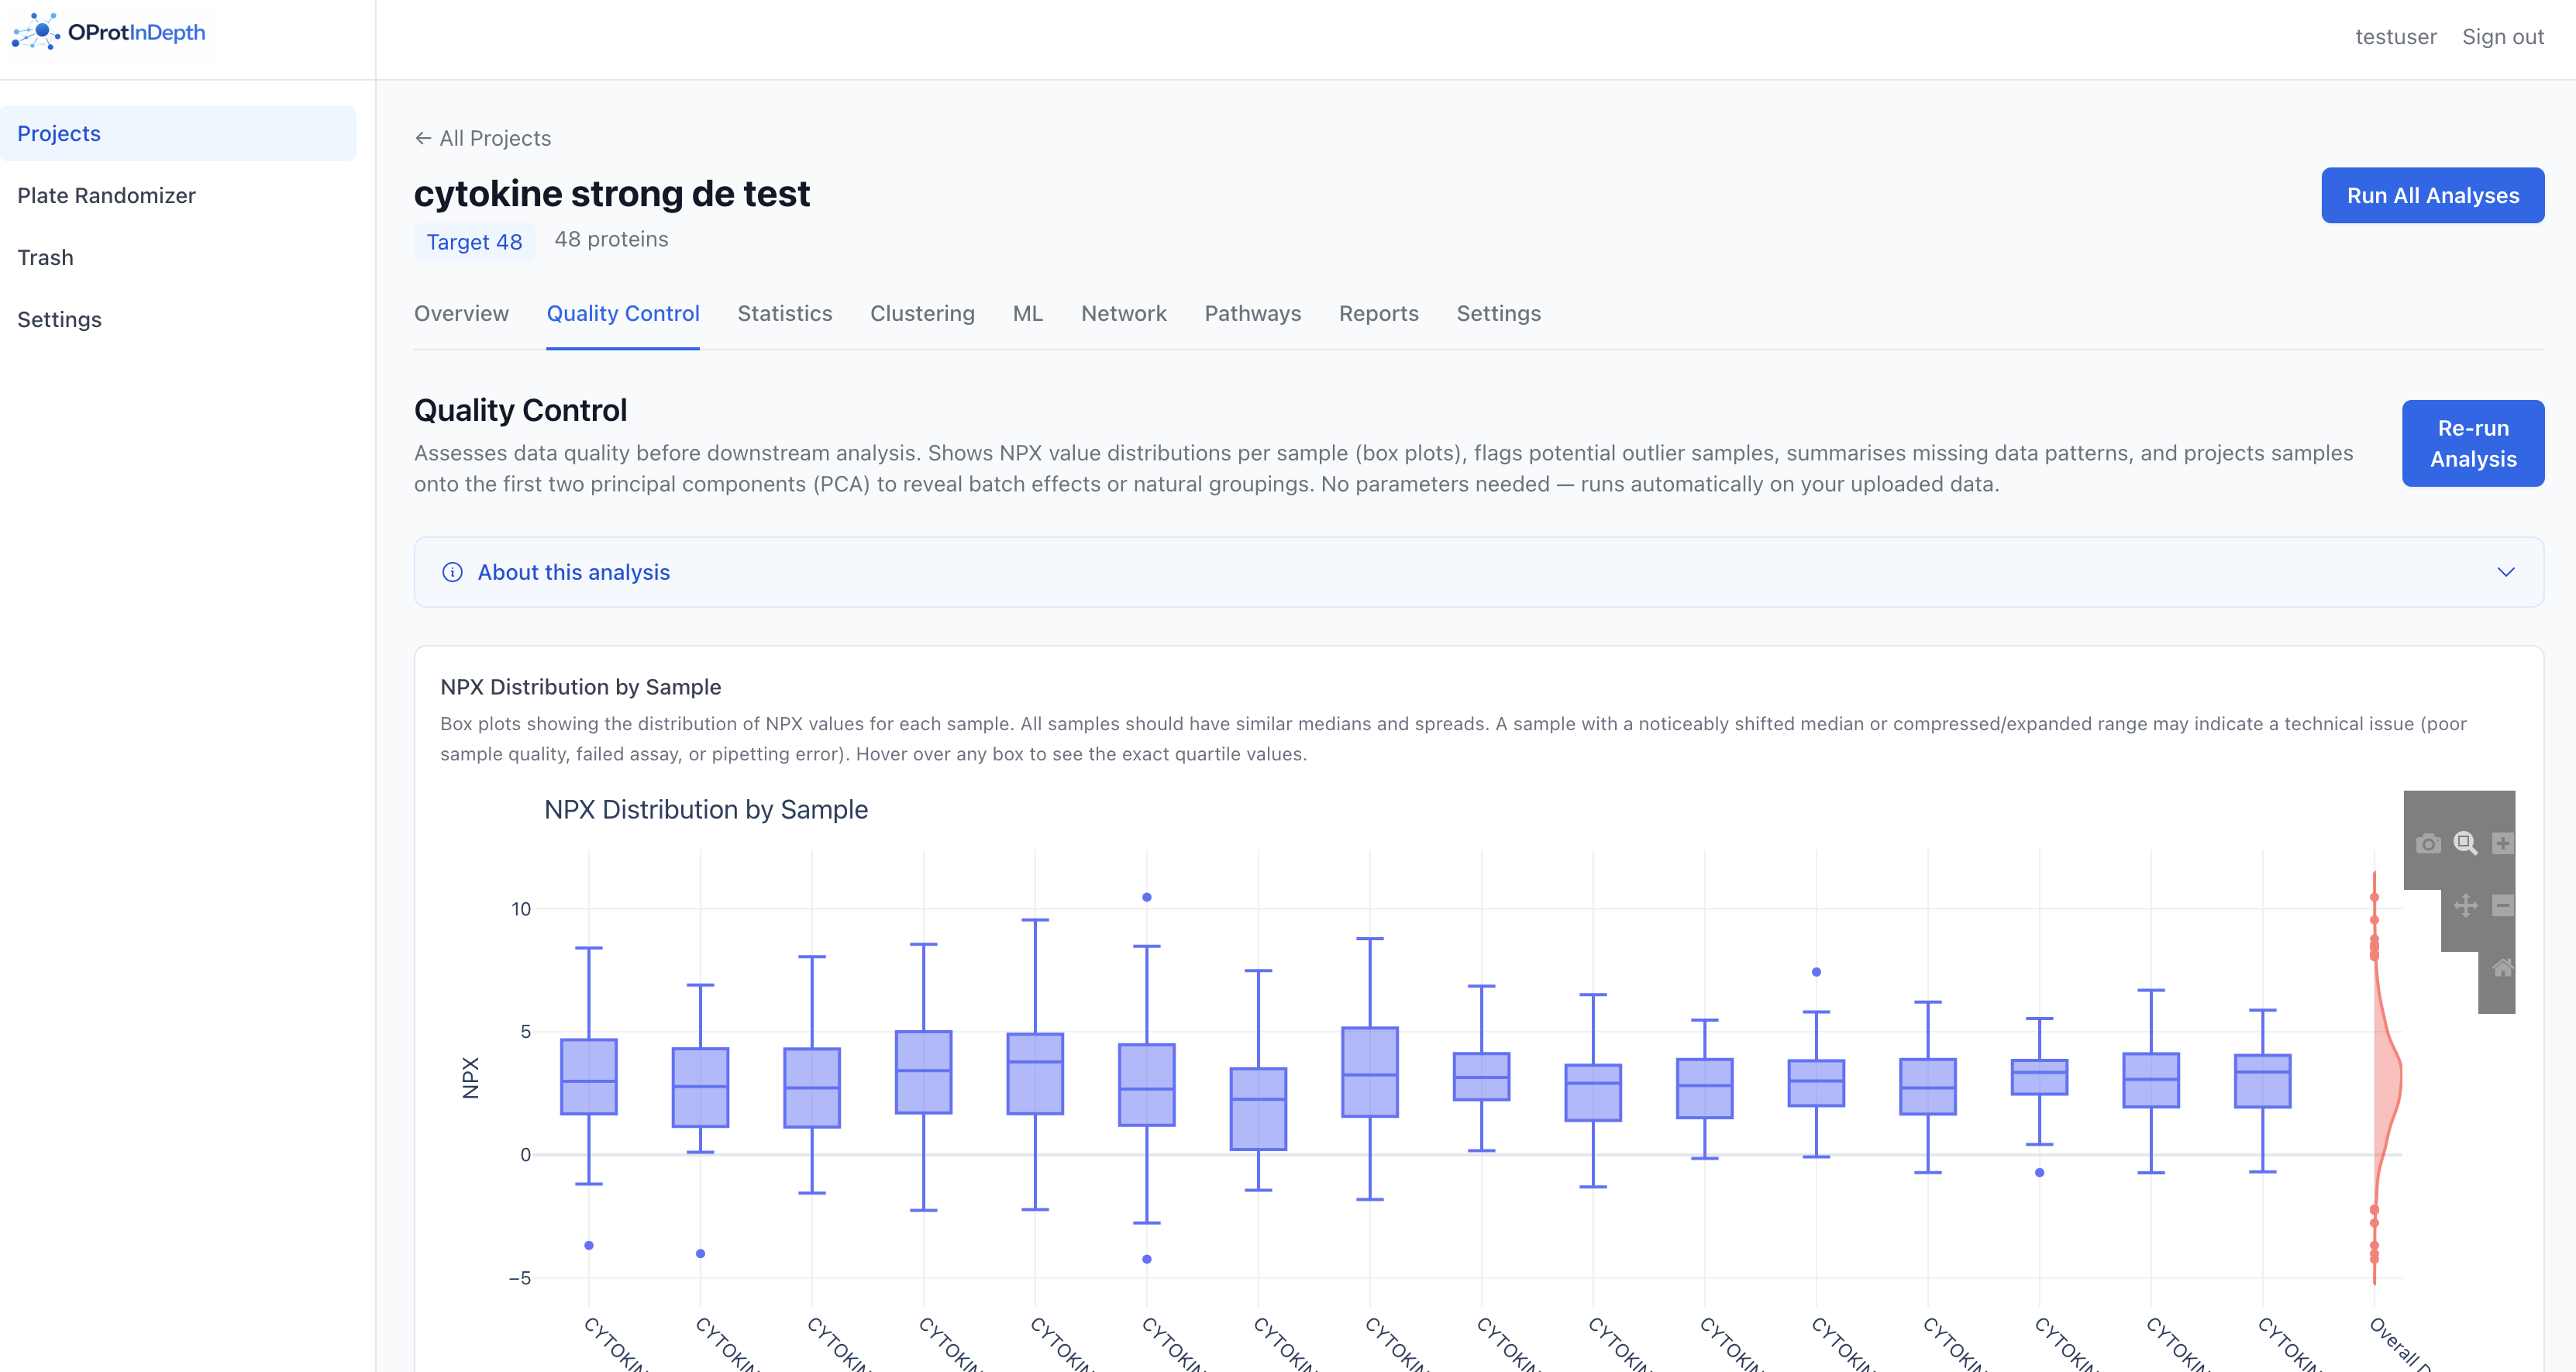
Quality control
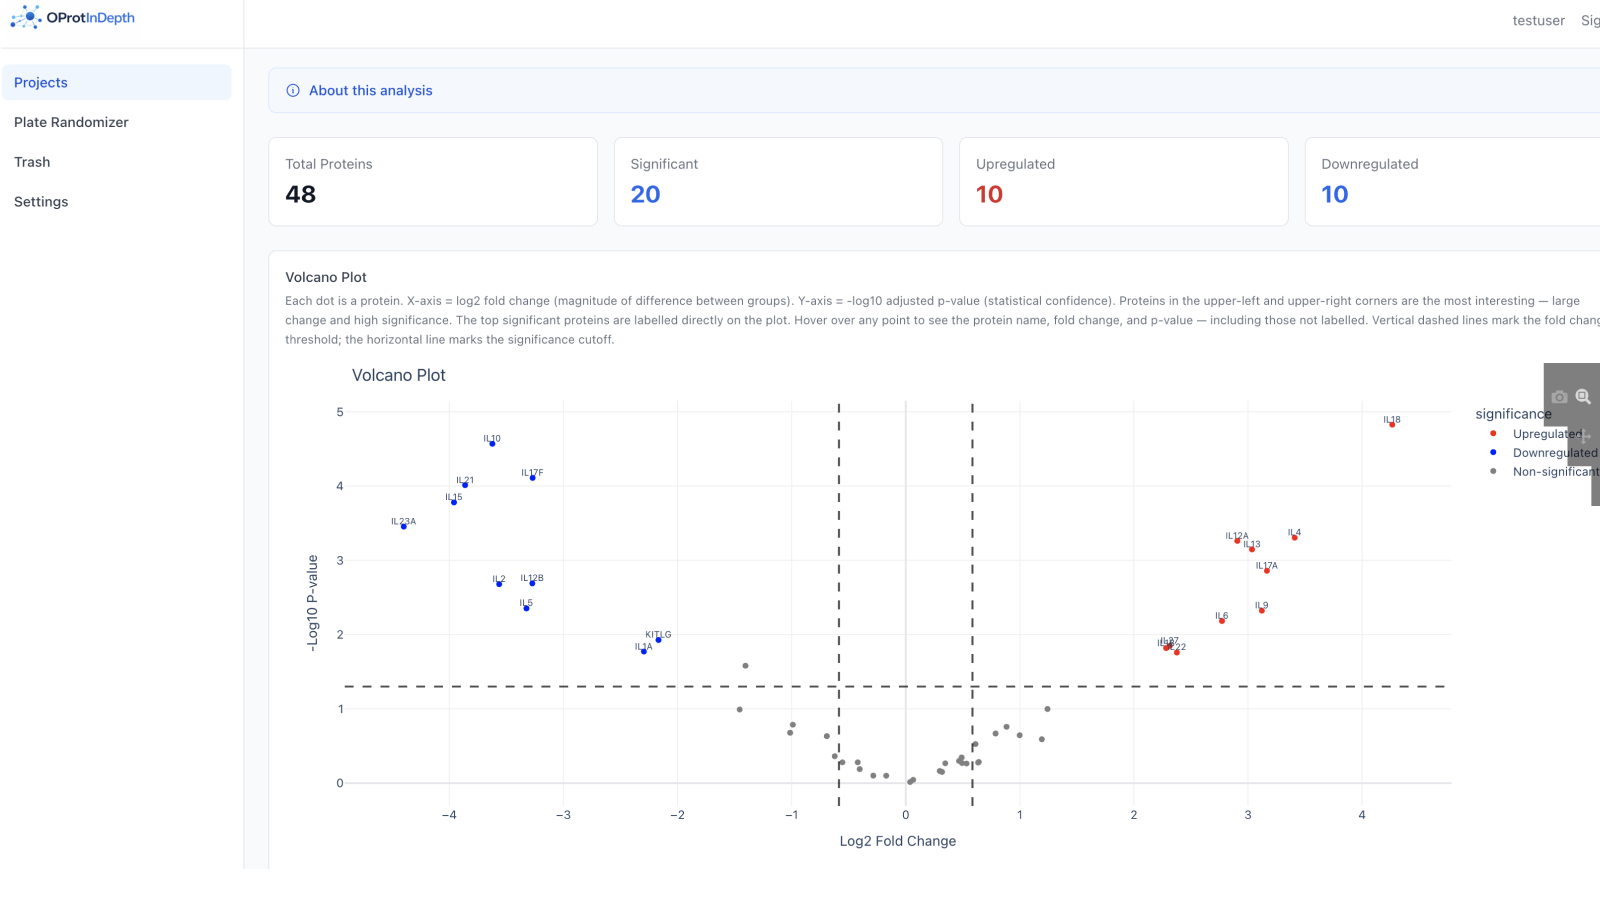
Differential abundance — volcano plot
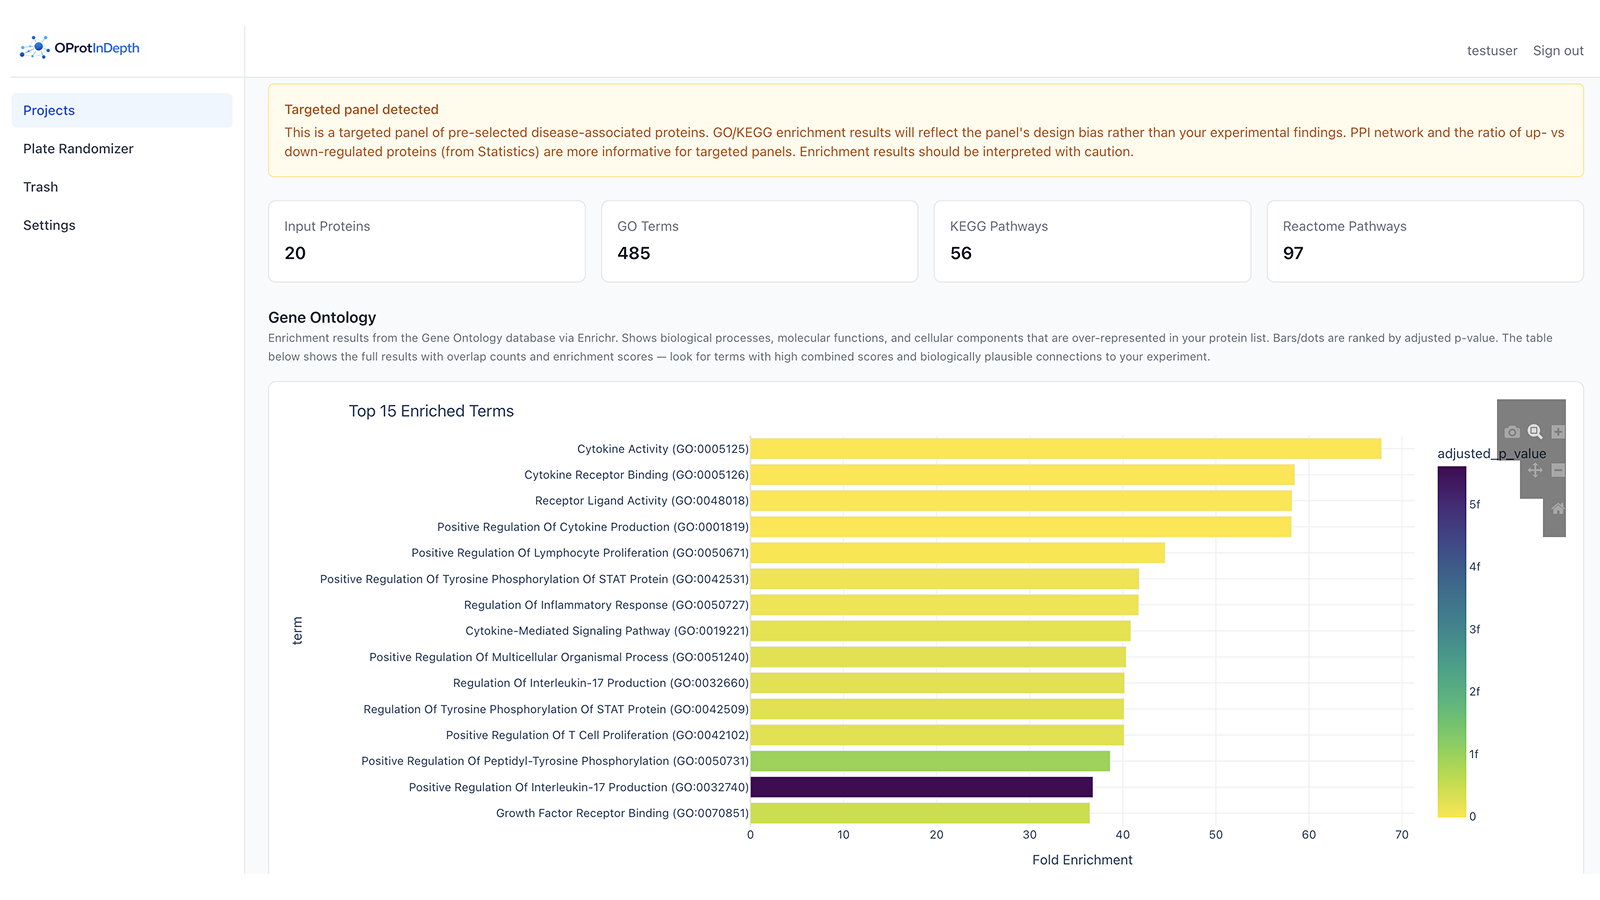
Pathway enrichment
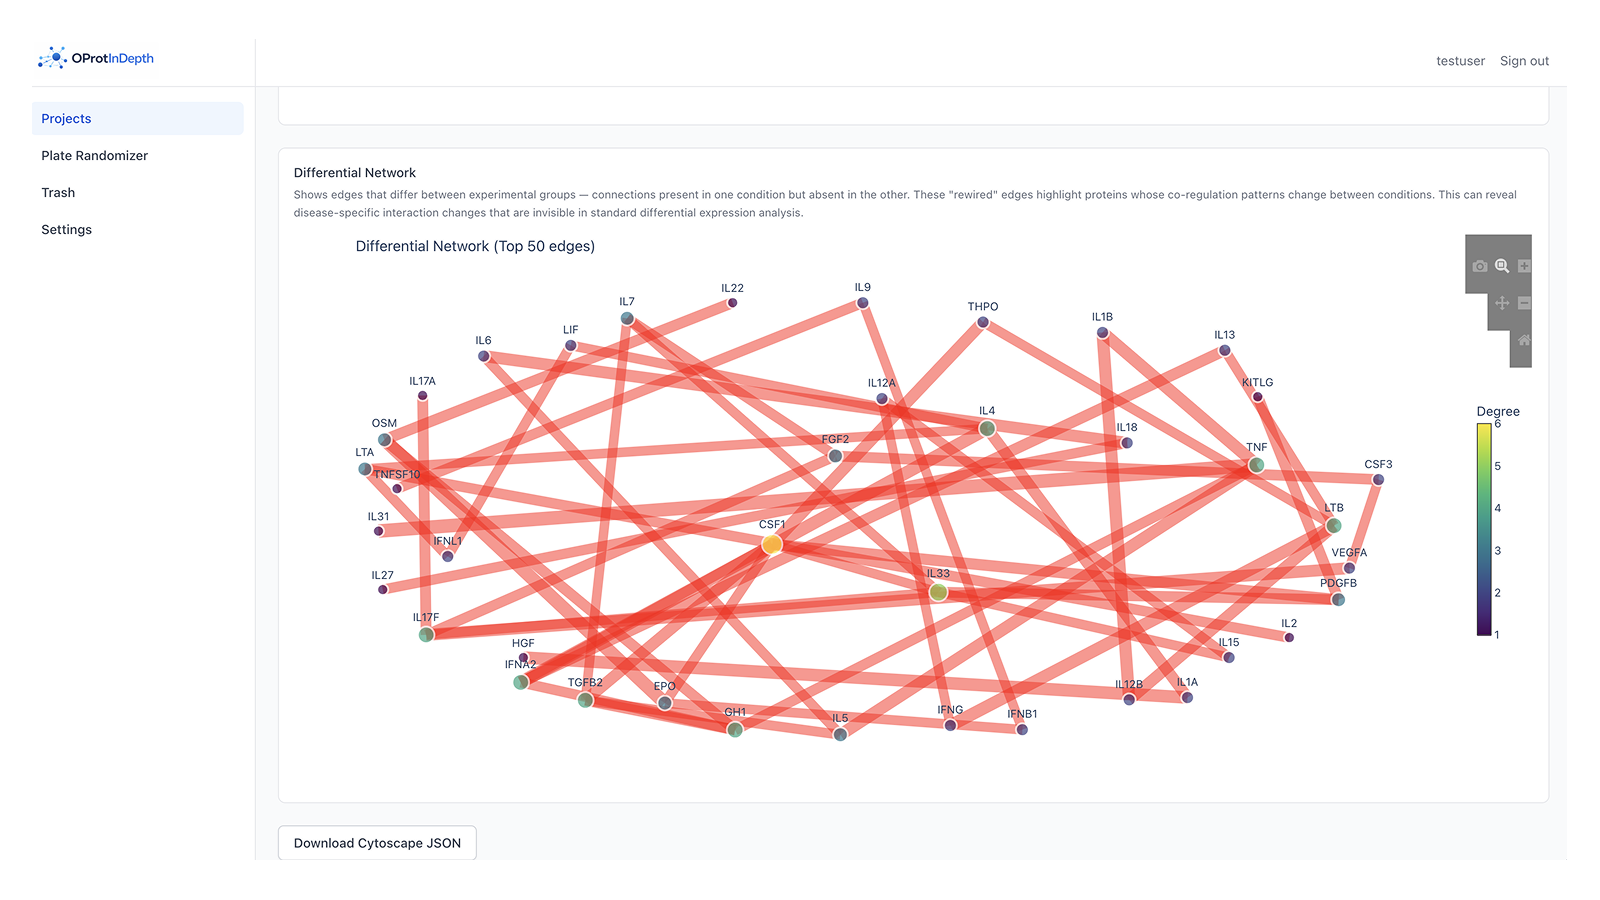
Differential interaction network
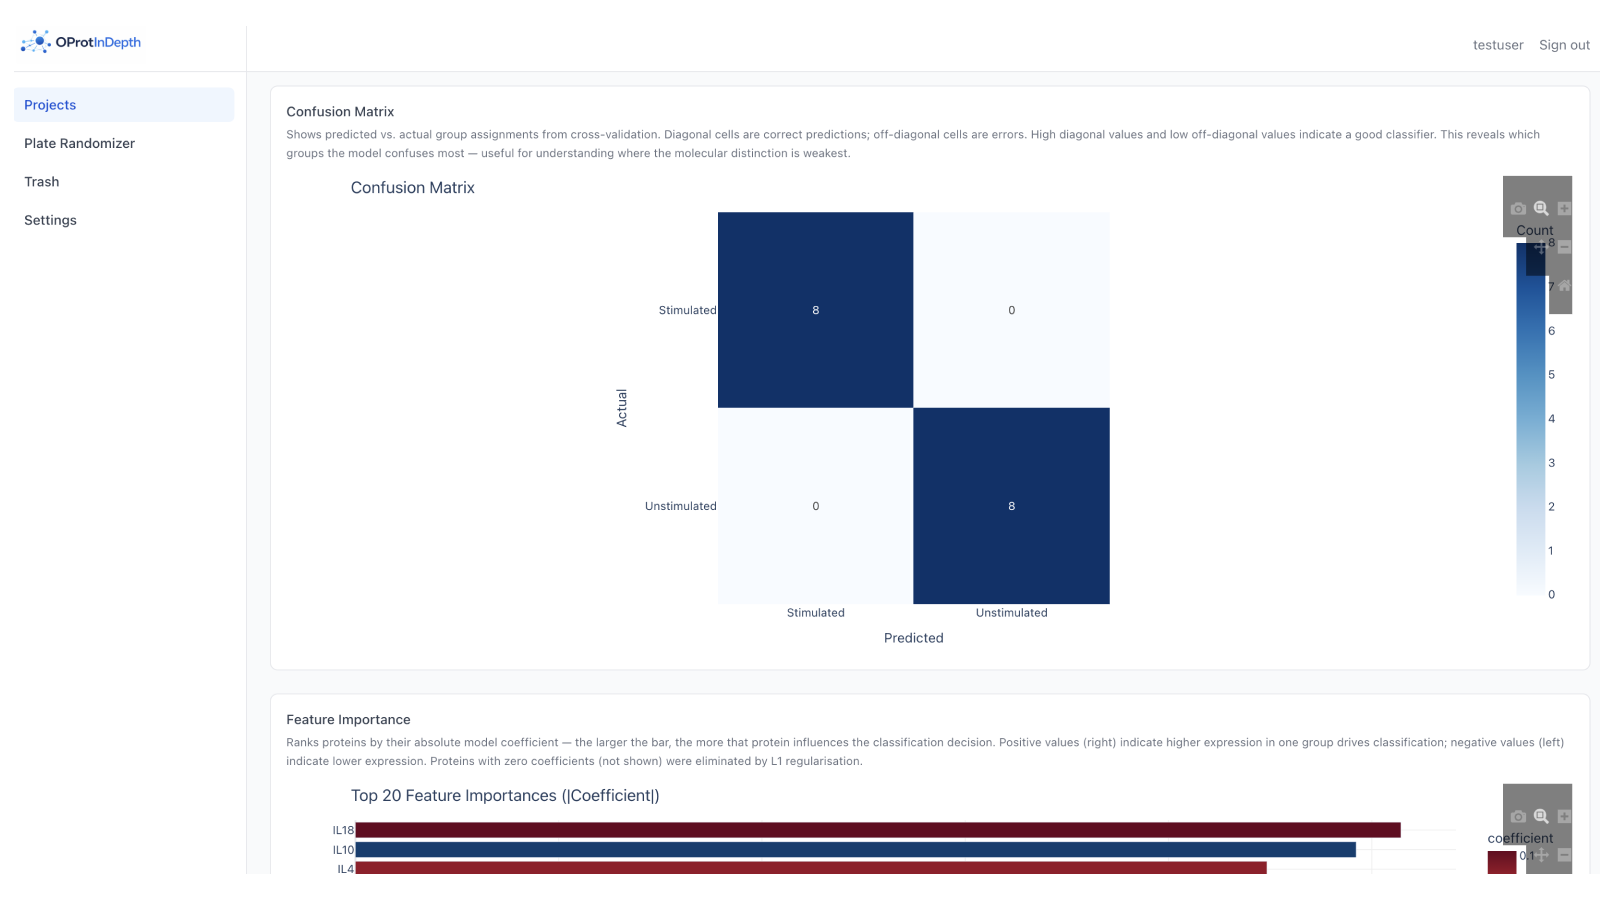
Classification & feature importance